17 Pie charts
17.1 Description
“In general, pie charts work well when the goal is to emphasize simple fractions, such as one-half, one-third, or one-quarter.”
“They also work well when we have very small datasets.” - Claus O. Wilke, Fundamentals of Data Visualization (2019)
Pie-charts are ideal for comparing the proportions of categorical variable values, and we can build pie-charts using the ggpubr package.
17.2 Set up
PACKAGES:
Install packages.
show/hide
install.packages("ggpubr")
library(ggpubr)
install.packages("ggplot2movies")
library(ggplot2movies)
library(ggplot2)
DATA:

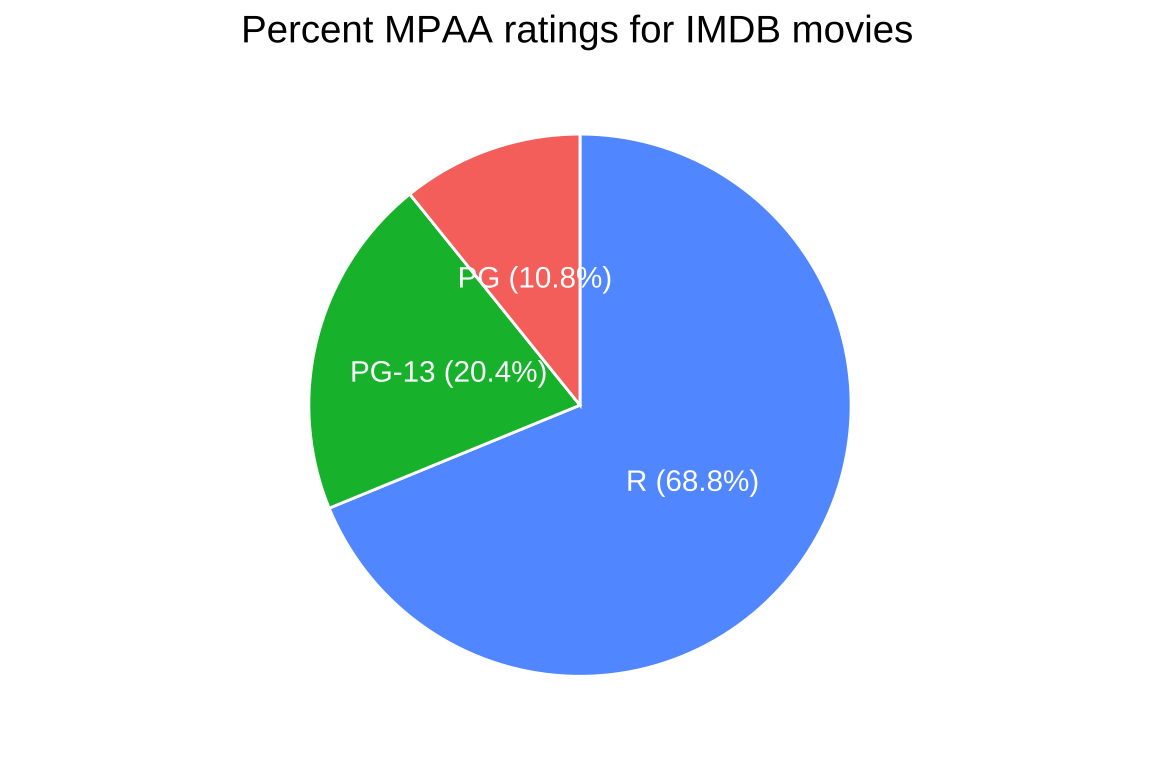
Remove the missing values and "NC-17" from mpaa and summarise the count and percent.
show/hide
movie_pie <- ggplot2movies::movies |>
  filter(mpaa != "" & mpaa != "NC-17") |>
  group_by(mpaa) |>
  summarise(cnt = n()) |>
  mutate(
    perc = round(cnt / sum(cnt), 3),
    mpaa = factor(mpaa,
          levels = c("PG", "PG-13", "R")))
glimpse(movie_pie)
#> Rows: 3
#> Columns: 3
#> $ mpaa <fct> PG, PG-13, R
#> $ cnt  <int> 528, 1003, 3377
#> $ perc <dbl> 0.108, 0.204, 0.688
17.3 Grammar
CODE:
Create labels with
labs()Initialize the graph with
ggplot()and providedataAssign
"perc"toxAssign
labstolabelAssign
"in"tolab.posAssign
"white"tolab.fontandcolorAssign
"mpaa"tofillRemove legend with
theme(legend.position = "none")
show/hide
labs <- paste0(movie_pie$mpaa, " (",
               (100*movie_pie$perc), "%)")
labs_pie <- labs(
  title = "Percent MPAA ratings for IMDB movies",
  x = "Percent MPAA rating")

ggp2_pie <- ggpubr::ggpie(movie_pie,
          x = "perc", label = labs,
          lab.pos = "in", lab.font = "#ffffff",
          fill = "mpaa", color = "#ffffff") +
    theme(legend.position = "none")

ggp2_pie +
  labs_pie
GRAPH: